Lyme Disease Evolution

The figure above shows predicted protein structures (top) and protein amino acid sequences (bottom) with areas showing statistically significant sigantures of natural selection indicated in yellow. Read more about our work on Lyme disease here. Or read some of the articles written about our work below:
Time-Lapse Microscopy
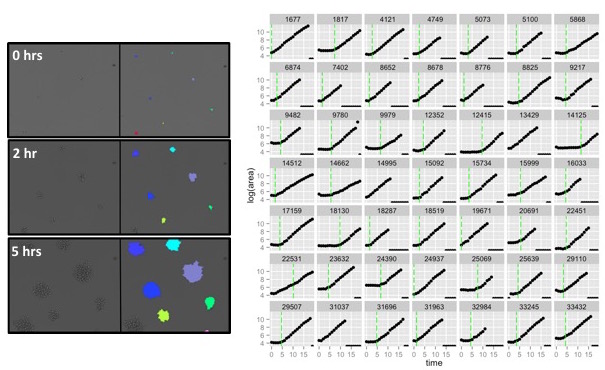
The left panel shows time-lapse microscopy data of microscopic yeast colonies growing under the microscope. The right panel shows growth data extracted from the images. Learn more about the time-lapse microscopy data here and check out my github for resources related to analyzing microcolony growth data.
Detecting Beneficial Mutations in Genomic Time-Series

The figure above shows the trajectory of a beneficial mutation rising in frequency during the evolution of yeast. Check out my github for resources to process genomics data, including machine learning methods for identifying beneficial mutations in genomic time-series of evolving populations.
